This week, our Strategy and Business Development Lead David looks at the power of data visualisation.
“I have always been a fan of maps. Maps of anything (On The Map by Simon Garfield is a great start if you are similarly inclined). But my favourite has always been geographical maps.
We are all familiar with the Mercator Projection, which is the most common way of showing (most) of the world on a single flat sheet of paper. It was developed over hundreds of years, and there are still many alternatives that have been introduced since it was first created in 1569. Many are even familiar with its numerous flaws, most importantly distorting the size of land masses as one moves closer to the poles. However, it was nearly universally adopted due to its use in navigation — the ability to move from any point in the map to any other in a straight line.
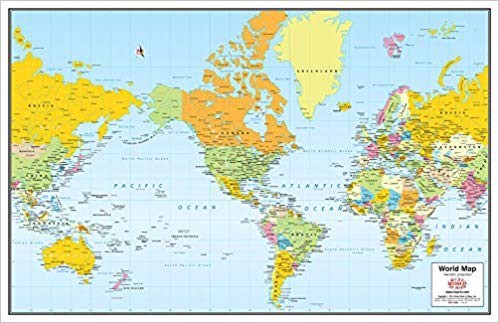
I recently saw this image, which surprised even me. The level of size distortion is much higher than I realised. Greenland and Antarctica in particular are of note, but even the United States and Russia are much smaller in comparison to how they are mapped. That got me to thinking more about the both the power and the challenge of data visualisation.
Taking visualized data at face value can be risky. The way it is visualised is incredibly important in ensuring that the correct conclusions can be drawn. Mercator solved a very real navigation challenge, but 450 years later many people do not understand the relative size of nations and continents because that wasn’t the problem he was solving.
This is the challenge with data.
For data to be fully optimised it must be presented in a way that can be comprehended. Data is useless without being able to derive insights from that data.
Alqami partners with our clients to ensure they get the most out of their data. We can help you better use your primary, secondary or external data to drive business strategy, including maintaining relevance and competitiveness through information advantage, reducing your cost baseline, building new revenue streams through external monetization, and valuing data whether internally or as part of M&A activities.”
Alqami and our data visualisation partner Amalytics will be presenting at the Digital Procurement World conference in Amsterdam on the 18th and 19th of September. We would love to have you join us there to discuss this and other topics in more detail.